Analysis-of-a-telecommunications-company
ConnectaTel – Customer Usage Analysis
An exploratory data analysis project focused on understanding mobile service usage patterns for ConnectaTel customers.
The project analyzes calls and SMS behavior, detects outliers, and builds customer segments based on usage patterns to support data-driven business decisions.
Identify usage patterns, detect atypical behaviors, and understand which customer segments show differentiated needs, in order to optimize the commercial offering and improve the user experience.
Project Objective
The goal of this project is to analyze how customers actually use mobile services in order to:
- Identify usage patterns in calls and text messages
- Detect outliers or abnormal behavior
- Understand how usage varies by age and plan type
- Create customer segments based on usage
- Generate business insights to improve mobile plans
Main notebook path
notebooks/Project-ConnectaTel_Gerardo_Olm.ipynb
Datasets
The project uses three datasets.
plans.csv
Plan catalog including:
- monthly price
- included minutes
- included data
- extra usage costs
users_latam.csv
Customer information.
Main variables:
user_idagecityplanreg_datechurn_date
Data quality issues detected:
- missing values in
city - invalid age values (
-999) - registration dates outside expected range
usage.csv
User activity records.
Includes:
- phone calls (
duration) - text messages (
length)
This dataset allows the analysis of actual service consumption.
Data quality issues detected:
- 0.125% Empty values in
Date - 55.19% Call Duration: 45% of users have made calls.
- 44.74% SMS Length: 55% of users have used messages included in the plan.
- Possible outliers were identified in message length
lengththat could be explored further (e.g., concatenated messages, atypical records, potential outliers).
Analysis Workflow
The project follows a structured data analysis process.
1️. Data Exploration
- dataset inspection
- variable types review
- identification of missing values
1.1. Working with copies
- Avoid mistakes in original datasets
2. Data Cleaning
- handling missing values
- fixing invalid age values
- converting date columns
- correcting inconsistent records
3. User Usage Profile
Usage metrics were aggregated per user:
- total calls
- total messages
- total call minutes
This created a user-level usage profile.
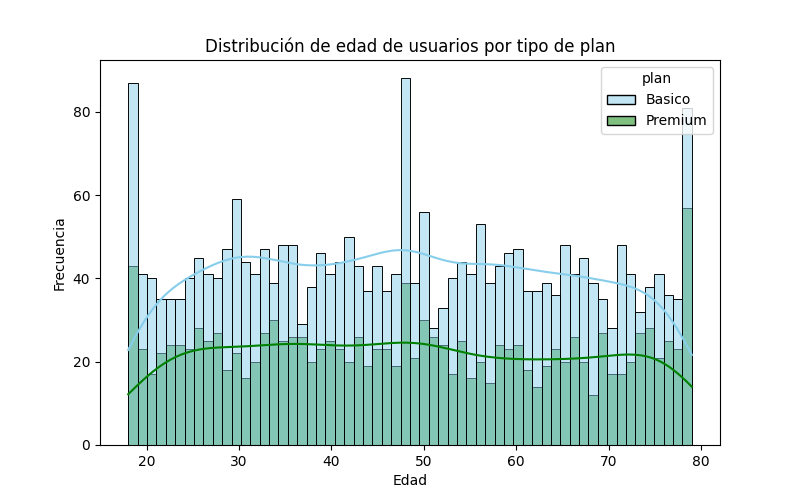
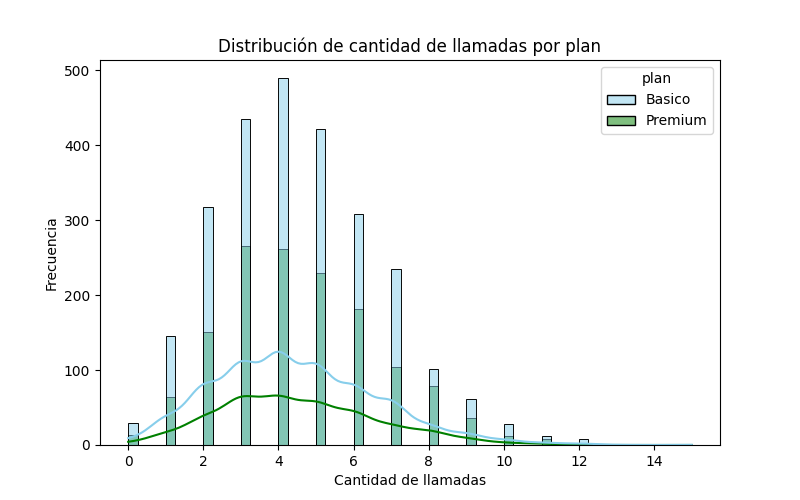
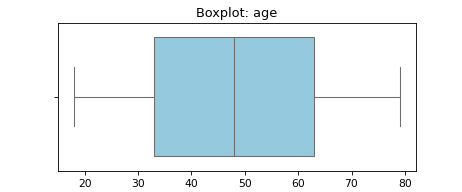
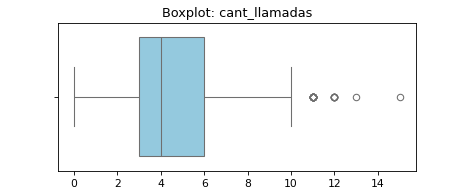
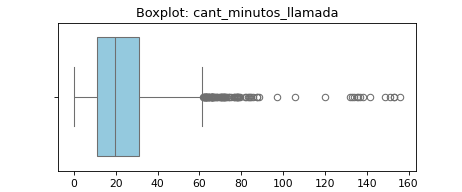
4️. Exploratory Data Analysis (EDA)
Distribution analysis for:
- Age
- Number of calls
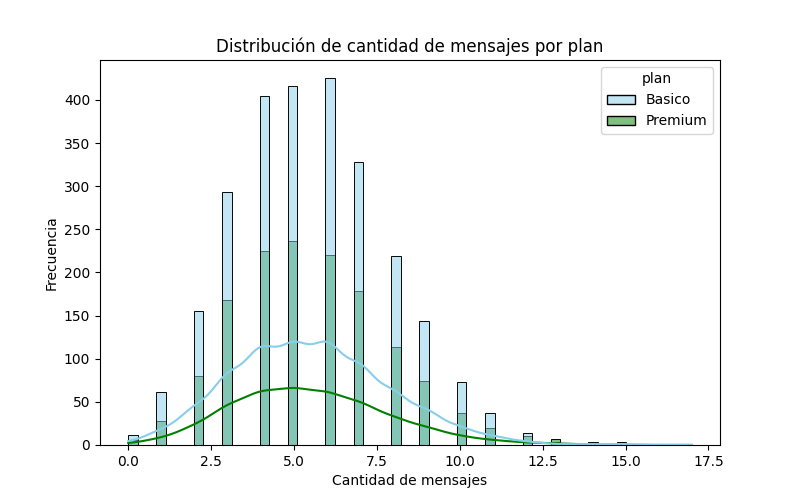
- Number of messages
- Call minutes
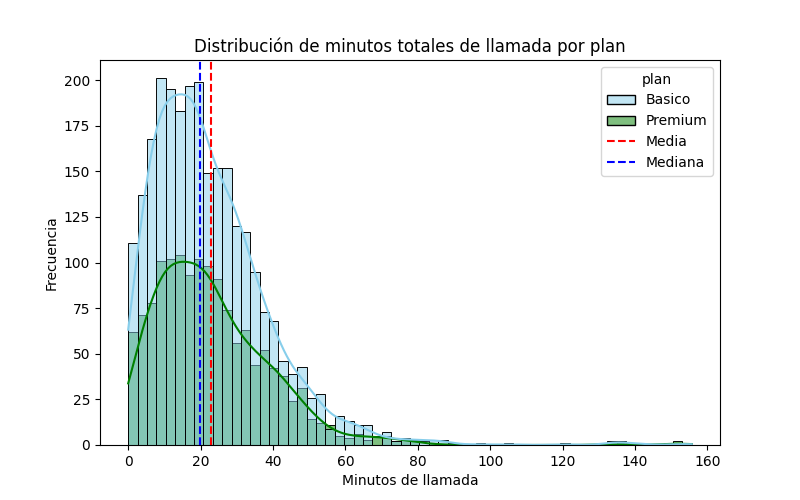
Distributions were compared between Basic and Premium plans.
5️. Outlier Detection
Outliers were identified using:
- boxplots
- IQR method
Variables analyzed:
- Age
- Call counts
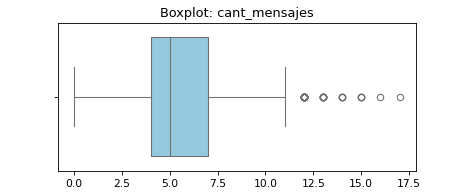
- Message counts
- Call minutes
This helps detect:
- abnormal usage
- potential data errors
- extreme user behavior.
6️. Customer Segmentation
Users were classified into two categories:
- Age
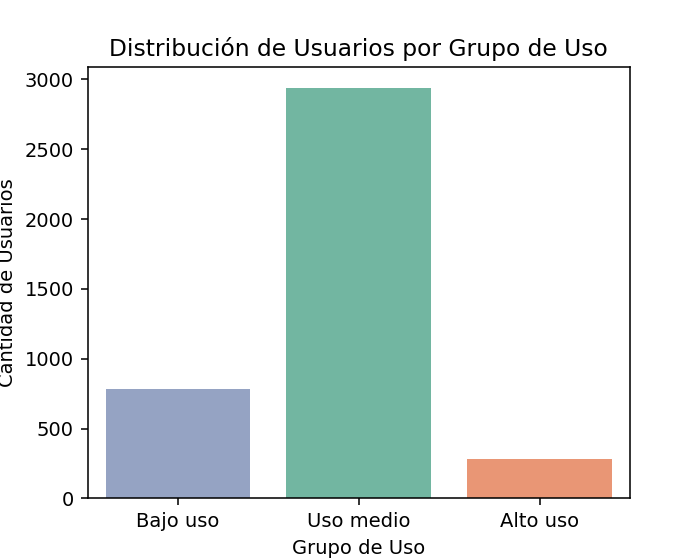
- Usage
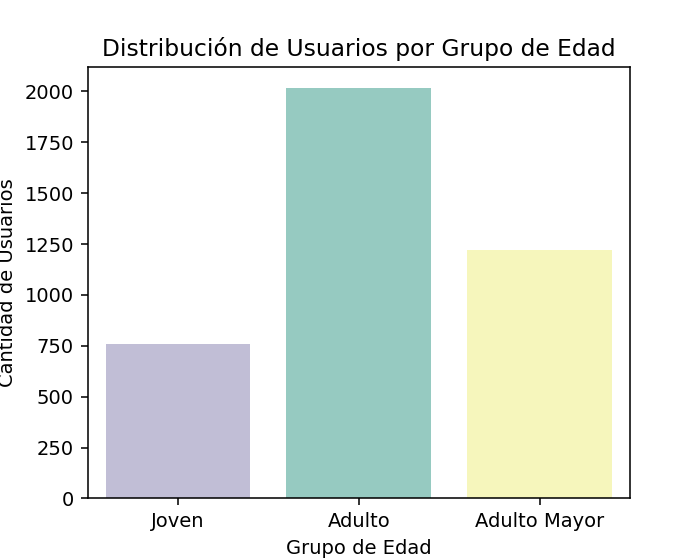
This allows identifying high-value customer groups.
How to Run the Project
Run in Google Colab
- Open Google Colab
- Upload the notebook
notebooks/Project-ConnectaTel_Gerardo_Olm.ipynb
- Upload datasets:
plans.csv
users_latam.csv
usage.csv
- Run the notebook cells sequentially.
Reproducibility
To reproduce the full analysis:
- Load datasets
- Execute data cleaning steps
- Generate user usage profile
- Perform exploratory data analysis
- Detect outliers
- Build customer segmentation
- Review insights
The notebook is organized sequentially for easy replication.
Key Skills Demonstrated
- Data Cleaning
- Exploratory Data Analysis (EDA)
- Data Visualization
- Outlier Detection
- Customer Segmentation
- Business Insight Generation
Author
Gerardo Olmedo – Data Analyst